
IELTSのライティングテストについて
IELTSのライティングテストでは、2つの異なる課題が与えられ、1時間でそれらを書き上げることが要求されます。
Task1では、与えられた図表の情報を示した報告書を作成することになります。
与えられる図表の種類としては、
(1)line graph 折れ線グラフ
(2)bar chart 棒グラフ
(3)pie chart 円グラフ
(4)table 数字の入った表
(5)map 地図
などがあります。
この報告書は最低150語なくてはなりません。
150語に満たない場合は、減点の対象になりますので注意しましょう。
この課題を書き上げる時間的な目安は20分程度になります。
Task2では、エッセーを書くための指示が与えられるので、その指示に従って、最低250語でエッセーを書くことになります。
250語に満たない場合に、減点の対象となるのは課題1と同じです。
この課題を書き上げる時間的な目安は40分程度になります。
ライティングTask1の報告書の書き方
今回は、Task1の報告書の書き方について見ていきましょう。
Task1では、図表に示された情報に関して受験者個人の意見を述べることは求められていません。
単に、与えられた図表に示された情報を正確に記述すればOKです。
折れ線グラフから得られる情報を記述する際に重要なのは、適切な時制を使って、時間とともに生じる変化や傾向を書くことです。
変化を記述するためによく使われる動詞があるので、以下にいくつか挙げておきます。
上昇変化を表現する動詞
・Rise (to)/(by)
・Increase (to)/(by)
・Go up (to)/(by)
・Climb (to)/(by)
・Grow (to)/(by)
下降変化を表現する動詞
・Fall (to)/(by)
・Decrease (to)/(by)
・Go down (to)/(by)
・Decline (to)/(by)
・Drop (to)/(by)
その他の変化/状態を表現する動詞
・Remain stable (at)
・Remain steady (at)
・Fluctuate
・Peak (at)
・Level out (at)
●これらの動詞を使った例文●
1a. In 1998, the unemployment rate in the UK increased to just over 4%.
2a. Between 1998 and 1999, the rate of unemployment in Australia declined by about 1.5%.
変化の程度や速さを表現する副詞を動詞と用いることによって、変化の様子をより詳細に記述できます。
変化の程度を表現する副詞
dramatically
sharply
substantially
significantly
considerably
moderately
slightly
変化の速さを表現する副詞
rapidly
quickly
swiftly
suddenly
steadily
gradually
slowly
これらの副詞を1a. 2a. の例文に用いると変化の様子がもっとはっきりします。
●例文●
1b. In 1998, the unemployment rate in the UK significantly increased to just over 4%.
2b. Between 1998 and 1999, the rate of unemployment in Australia gradually declined by about 1.5%.
ライティングのテストを通じて、様々な言語表現を駆使し、アピールすることが重要になります。
ですから、効果的に変化を表現するためには、動詞だけではなく、名詞を用いても表現できるようになりましょう。
変化を記述するのに使われる名詞としては、次のようなものがあります。
上昇変化を表現する名詞
A rise (in)
An increase (in)
A growth (in)
下降変化を表現する名詞
A fall (in)
A decrease (in)
A decline (in)
その他の変化/状態を表現する名詞<
A fluctuation (in)
A peak (of)
A levelling out (at)
A drop (in)
これらの名詞と次の構文を組み合わせて使うと便利です。
There + to be + noun + in 〜.
●例文●
3. From 1999 to 2001, there was a fluctuation in Australia’s unemployment rate.
4a. In 2002, there was a rise in the number of people not working in the UK.
5a. Between 2001 and 2002, there was a decline in the number of people without work in Australia.
変化の程度や速さを表現する形容詞で名詞を修飾させることによって、変化の様子をより詳細に記述できます。
変化の程度を表現する形容詞
dramatic
sharp
substantial
significant
considerable
moderate
slight
変化の速さを表現する形容詞
rapid
quick
swift
steady
gradual
slow
これらの形容詞を 4a. 5a. の例文に用いると変化の様子がもっとはっきりします。
●例文●
4b. In 2002, there was a rapid rise in the number of people not working in the UK.
5b. Between 2001 and 2002, there was a considerable decline in the number of people without work in Australia.
このTask1では、前置詞の使い方も重要になります。
ある特定の数値に到達したことを+-示すためには、前置詞 “to” を使います。
どれくらい変化が生じたのかを示すためには、動詞と一緒に前置詞 “by” を名詞と一緒に前置詞 “of” を使います。
●例文●
6. Australia’s unemployment rate increased to just over 5% in 2003.
7. The percentage of unemployed British people dropped by 1.5% in 2001.
8. In 2002, there was a rise of 1.5% in Britain’s unemployment rate.
ライティングでは、色々な言語表現を用いるように心掛け、同じ表現を何度も繰り返し使うのは避けましょう。
上に挙げた例文の中で、“英国/豪州の失業者の割合”という意味内容が様々な形で表現されていたのに気が付きましたか?
時制にも気をつける
報告書を書くうえでもう1つ重要なことは、正確な時制の運用です。
多くの場合、過去の出来事について報告することになるので、その場合、単純過去を使うことになります。
しかしながら、図表によっては、現在進行している事柄や未来の予測をしているものがあるので、使う時制には気をつけましょう。
ライティングで与えられる図表には、たくさんの情報が盛り込まれているので、すべての情報を報告書に書くことは時間的にできません。
したがって、書くべき情報の取捨選択が重要になります。
まず、折れ線グラフの全体的な傾向を読み取り、その後で、個々の変化に目を向けるようにしましょう。
報告書の書式としては、まず始めに、折れ線グラフが何についての情報を描いたものなのかを導入で説明します。
次に、個々の変化について本論で詳述します。
そして最後に、全体的なグラフの傾向を結論で要約して終わります。
以上の点を踏まえて、解答例を書いてみましょう。
■課題1の解答例(クリックすると解答例が表示されます。)
<解答例>
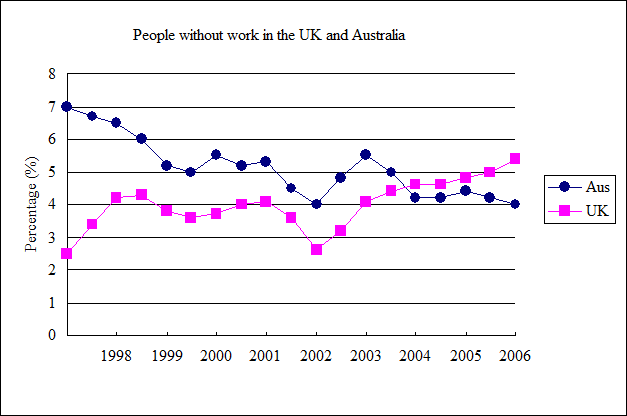
The graph provides information concerning the rate of unemployment in the UK and Australia over the period from 1997 to 2006.
According to the graph, the unemployment rate in the UK stood at 2.5% and then significantly increased by 1.5% to just over 4% in 1998. At the same time, Australia’s rate of unemployment went down moderately from 7% to 6.5%. After 1998, there was a gradual decline of 1.5% until 2000 in Australia’s rate while the number of unemployed people in the UK dipped slightly and then remained steady at 4% until 2001.
Between 2001 and 2003, both countries had similar trends with Australia having a higher rate of unemployment during this period. However, during 2003 there was a rapid fall of 1.5% in Australia while the unemployment rate in the UK continued to rise gradually and overtook that of Australia in 2004. From 2004 to 2006, the percentage of people without work in Australia remained constant at just over 4% but the UK’s rate grew steadily and reached a peak of 5.5% in 2006.
Overall, the graph shows how Australia’s rate of unemployment decreased by 3% while that of the UK increased by 3%. From this information, it could be assumed that Australia’s rate of unemployment will continue to decrease in the future.
無料カウンセリングのご案内
IELTSライティング対策でお悩みの方へ。
・書き方がわからない
・スコアが伸び悩んでいる
・添削してほしい
ILC国際語学センターでは無料カウンセリングを実施しています。
あなたの目標に合わせた最適な学習プランをご提案します。

本コラムの著作権はILC国際語学センターに帰属します。個人での利用を除き、転載・引用を禁じます。
本コラムは週間Student Timesに掲載された記事を、2026年度版に修正・更新しております。
コラム公開日:2007年9月12日 コラム更新日:2026年4月17日